It’s always funny to me how quickly an election becomes a distant memory. The clarity that follows election results makes all the pontification, prophesying, and predicting beforehand seem immediately ancient.
The big takeaway from the 2021 election is that the polls were quite good. They were also extremely sensitive — both over and under emphasizing shifts in the electorate. Additionally, they, along with the rest of the media and many German voters, were surprised by the SPD’s big comeback.
This election also had some personal takeaways for me:
- I underestimated the amount of uncertainty Merkel’s departure created.
- My model turned out to be a lot smarter than my own takes, which were partly based on its predictions.
- My biggest misstep was my certainty that the SPD was yesterday’s news (even though uncertainty is a huge part of my job and I should’ve known better).
As for how well my model did, I would say it’s overall performance was good — but not great. It beat the polls throughout the election cycle, but its main flaw was that it predicted that the CDU/CSU would finish ahead of the SPD. They didn’t.
I believe those kinds of final predictions are really important to readers. In my opinion, it’s more important to know which way the wind is blowing three months before the election than three days, but I understand that many people don’t really tune in until a few days before the election.
This post is an evaluation of how well my model did. I’ll start out with the overall precision and then look at individual parties. I’ll also let you in on some secrets behind my model that may help to illustrate my model’s good and bad predictions.
The Vorcast model beat the polls
I started this blog with one clear goal: to create a more long-term, critical perspective on German politics. Instead of going with the media hype of the week, I want my readers to be able to see past the noise at what really matters to voters. I think my model achieved this overall (even if my own analysis often did not).
So let’s compare my model’s predictions to the polls. We’re going to look at the absolute error of a simple polling average and my model’s predictions for all parties.
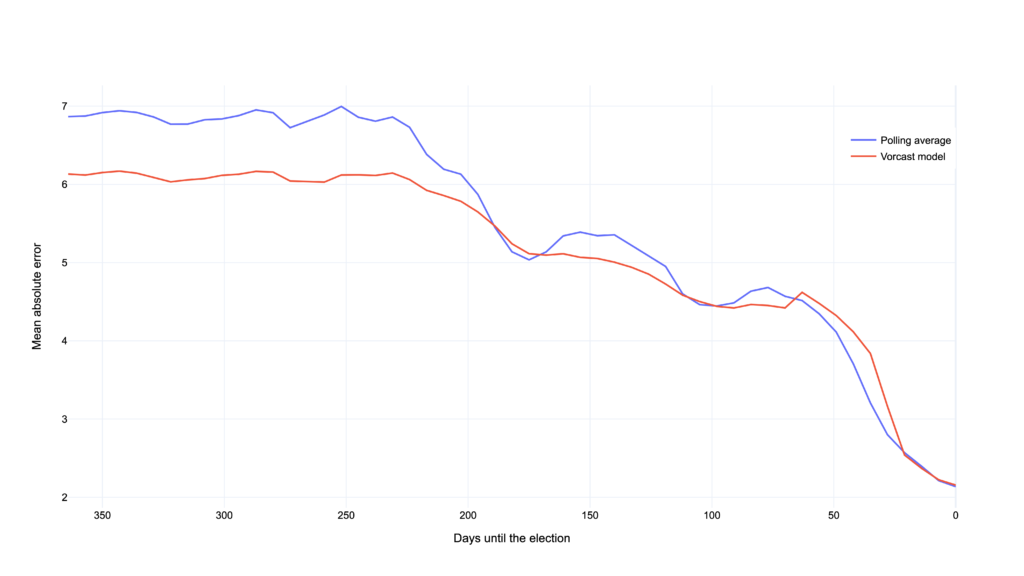
My model predictions were closer to the final election result at almost any point during the final year of the 2021 election cycle. Towards the end of the cycle, both my model and the polls were about evenly precise which really speaks to the high quality of the German polling institutes.
I count this as a success for my model because my hypothesis (that you can amend the polls with additional data so you can get a more accurate picture of the electorate) turned out to be true. One thing I will definitely investigate more and will try to improve in my next model’s version, is how that late SPD surge came to be. One obvious explanation would be the candidate’s popularity (Olaf Scholz was consistently the most popular candidate, aside from “none of the above”) but there could be other factors at play.
What the chart above (and the mean absolute error overall) doesn’t capture, is another goal of mine which is to not just be more precise than the polls, but to show a more steady, less noisy picture of the electorate. I want movement in my model’s predictions to signify a real change in the electorate rather than just a consequence of a short-lived media hype.
A good model turns down the noise
Polls in Germany are really accurate. I’ve written an entire post about how good I think they are and why they deserve more attention. Turns out, I wasn’t alone in this thinking. The polls got more well-deserved attention than ever before during this election cycle. Many big German publications posted polling averages, most notably Die Zeit and Der Spiegel. Die Süddeutsche Zeitung and The Economist even published prediction models (though much later in the race than Vorcast, thank you for asking).
Having sung the praises of the polls, allow me to also level some criticism at them. Polls in Germany are quite sensitive to sudden shifts in the electorate. Just compare these two charts: the first one shows my model’s output and the second one shows the polling average.
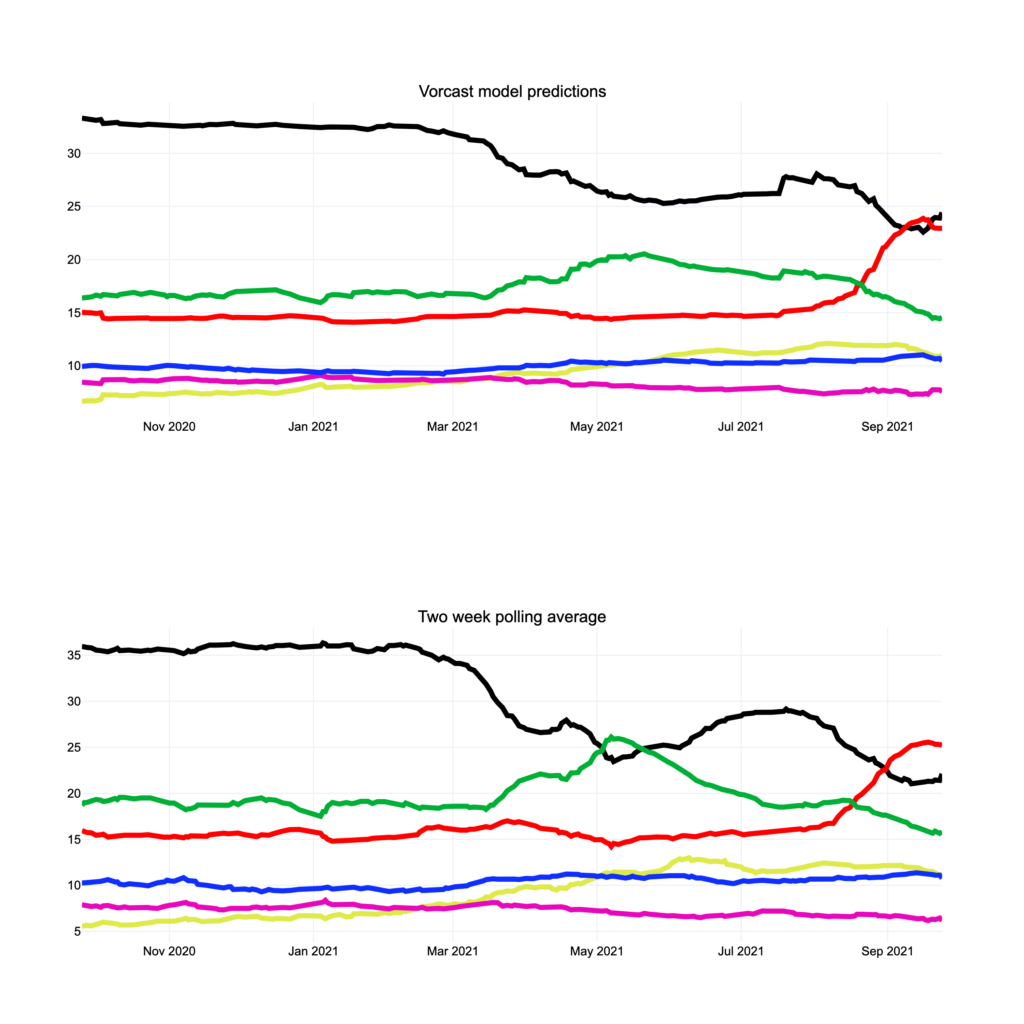
My model’s output shows a lot less fluctuation. The big green bump is noticeably absent, the CDUCSU really only undergoes two big shifts, and the smaller parties are less noisy as well. The second one has much more jittery lines and sees the Greens overtake the CDU/CSU at some point. I’m happy with this result because I think if you followed my model, you were able to see real shifts in the parties popularity and would’ve been less inclined to believe the media hype about individual polls.
Vorcast is actually six forecasts
So here’s something that I haven’t talked about before: my model actually does an individual prediction for each party. The fundamentals I use in addition to the polls (read more about what those fundamentals are here) to predict each parties’ result have different weights depending on which party’s share of the electorate I’m trying to predict.
Now that you know this information and I’ve blown your mind, I’d like to go into the big wins and losses of my model. Going through all the parties might be a bit exhaustive so here’s a quick summary of my model’s wins:
- The CDU/CSU’s downward shift was extremely accurately captured by my model down to the final election results. The polls swung wildly for the Christian Democrats and my model was a lot steadier and provided a clearer view of their actual popularity.
- The Green party moved in a 5% range in my model versus a 12% range in the polls. Unlike the polls, my model never saw them ahead of the CDU/CSU at any point in the race. If you followed my model, The Greens subpar (though historically their most successful) showing didn’t surprise you. They ended very close to where I had predicted them a full year before the election
- The FDP and AFD were much closer in popularity than the polls predicted. My model consistently reflected that.
And here are the big failures of my model:
- My model predicted the SPD to come in second after the CDU/CSU and was more off than the polls by 1.2%.
- The Linke decisively underperformed the polls and my model’s predictions. My model was a lot more bullish on them and was quite wrong about that. They ended up having a dismal showing and so did my model in trying to predict their vote share.
You can look at the interactive chart below to see my model’s predictions, a simple polling average, as well as all individual polls of the final year of the 2021 election cycle. You can zoom in to see where my model and the polls differed or to track individual parties throughout the year. The free floating dots at the end represent the final election results.
What’s next for Vorcast
Here’s another peek behind the curtain: there were two versions of my model. The difference between them was the degree to how much they weigh the fundamentals, the additional features that aren’t polls.
Since Angela Merkel wasn’t running this time around, I decided to go with the more fundamentals heavy version and it was the wrong call. If I had gone with the other one, my model’s output would’ve been closer to the polls while still being more accurate than them. My predictions would’ve been less stable and more sensitive to polling results, but I think my final election predictions would’ve been even more precise. This is what’s called a tradeoff in data science, normal people might say: you win some, you lose some.
I published this blog and my model two months after becoming a father. I’m really proud of what my sleep-deprived brain came up with. But looking at my takes and my code, I can see that there is a lot left for me to learn and improve. There’s a number of things I want to do with this project: refactor my code base, improve my visualizations, dip my toe into regional election forecasting, make this blog bilingual, write data takes on non-election topics…
You have my sincere gratitude for sticking with me during this wild election and I hope you found some utility in this blog and my work. If you want to stay up-to-date, follow me on Twitter or check back here every now and then. Until then, auf Wiedersehen.