This blog is about polls and forecasting, so what do you think my answer will be to this question?
Should Germany care more about polling? Yes, it should, but it should care less about individual polls and more about the aggregate. In this post, I’ll take you through what to be wary of when it comes to individual polls, how aggregates are more insightful, and how I create the Vorcast Polling Average.
The main points I want you to take away from this post are:
- Political polling in Germany is pretty good, meaning it captures the electorate’s actual voting intentions quite well
- Over-emphasizing individual polls is not the way to go if you really want to know where Germany stands
- Aggregating polls will give you a more precise picture of the electorate (most of the time)
Bring the noise: individual polls
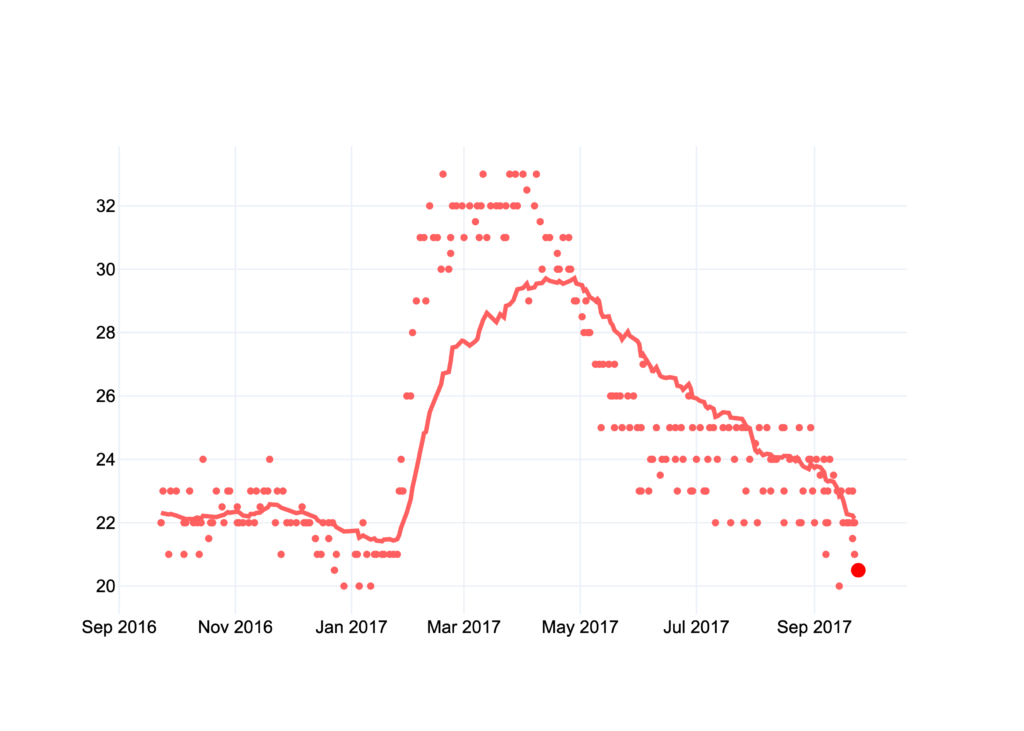
When you analyze data for trends, you always want to separate the signal from the noise — which data points really point towards a bigger, underlying trend, and which ones are outliers. To illustrate this point, let’s look at all the polling results for the Linke (the most leftward-leaning party in Germany) for the last year of the election cycle in 2017.
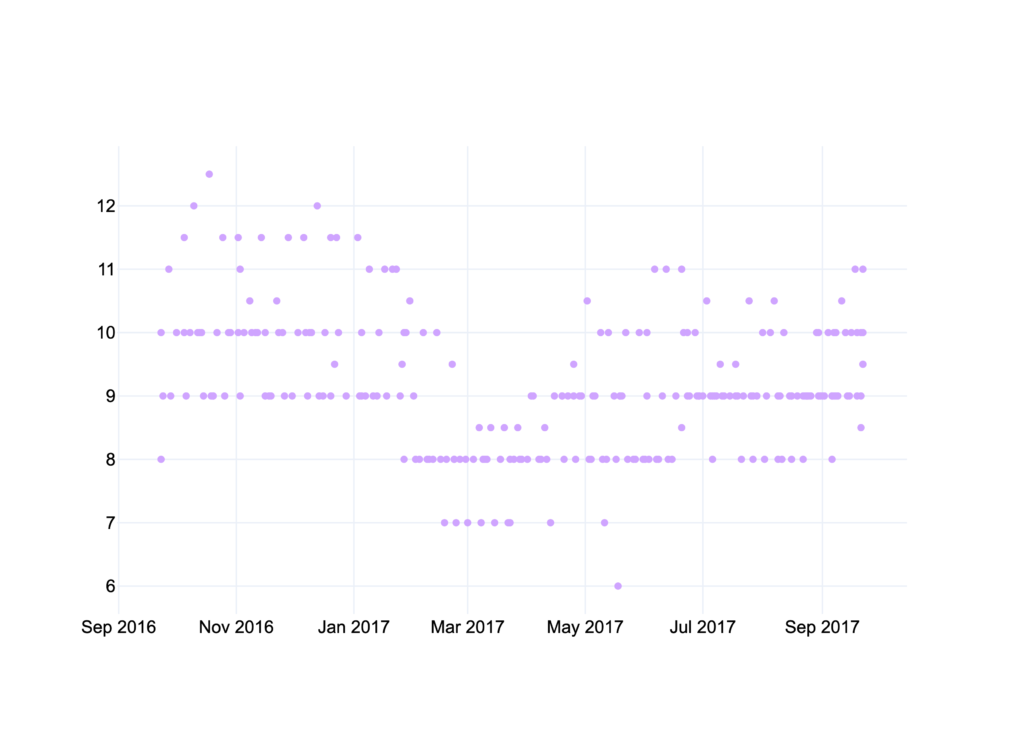
Humans are really good at recognizing patterns — sometimes a little too good. There are several incorrect conclusions you could draw from these data points.
- The Linke went up and down in popularity
- The Linke are at 12% and will be really successful
- The Linke are at 6-7% and will have a bad showing
Now let’s pretend we’re someone who is highly partisan and either really dislikes or intensely agrees with the Linke. Out of all these data points, these are the ones we would pay the most attention to:
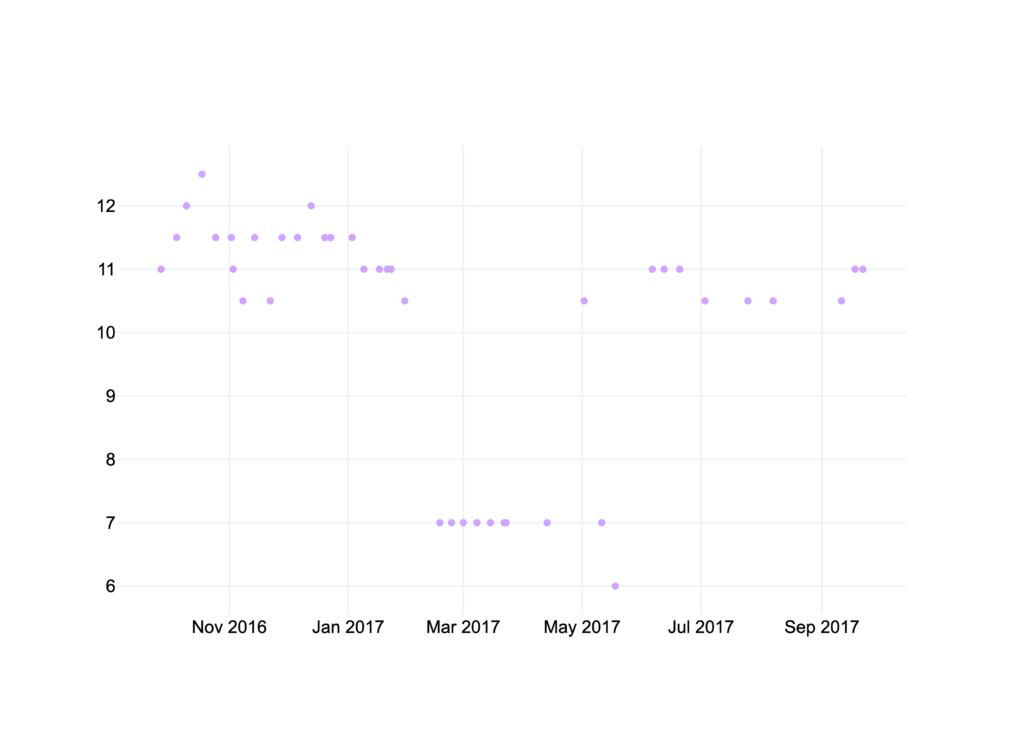
The Linke basically doubled or halved their support (depending on your point of view) over the course of 12 months. If you don’t agree with their politics, you could have triumphantly pointed at polls showing them at 6% or despaired when they were at 12%.
Of course, none of this is particularly insightful or accurate. When we add the Vorcast Polling Average of all the data points, we can see that the Linke had a fairly regular election year.
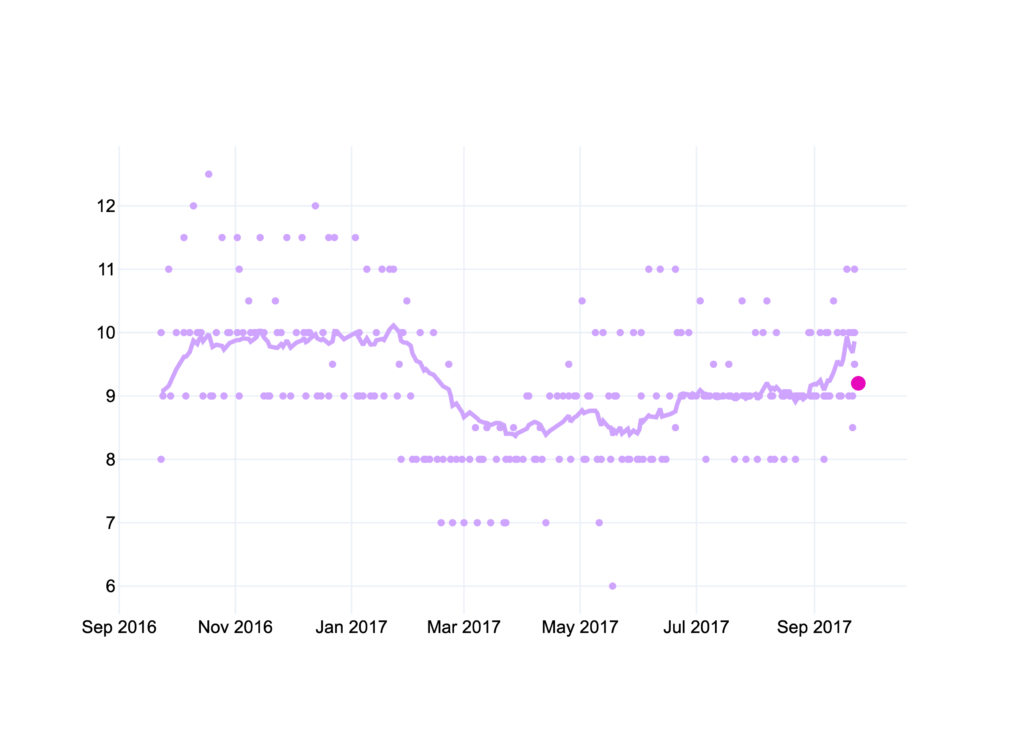
The Vorcast Polling Average of the Linke never went higher than 10% and it never dipped below 8.5%. All of a sudden, that 6 point gap between the outlier polls is reduced to 1.5. The Linke ended up with 9.2% in the election, pretty much exactly the halfway point between the highest and lowest point of the average. So what first looked like a turbulent year that saw the Linke go from 12% to 6% and back to 11%, looks pretty calm and kind of boring now. But boring data is great. Boring data is reliable — which means it’s predictable.
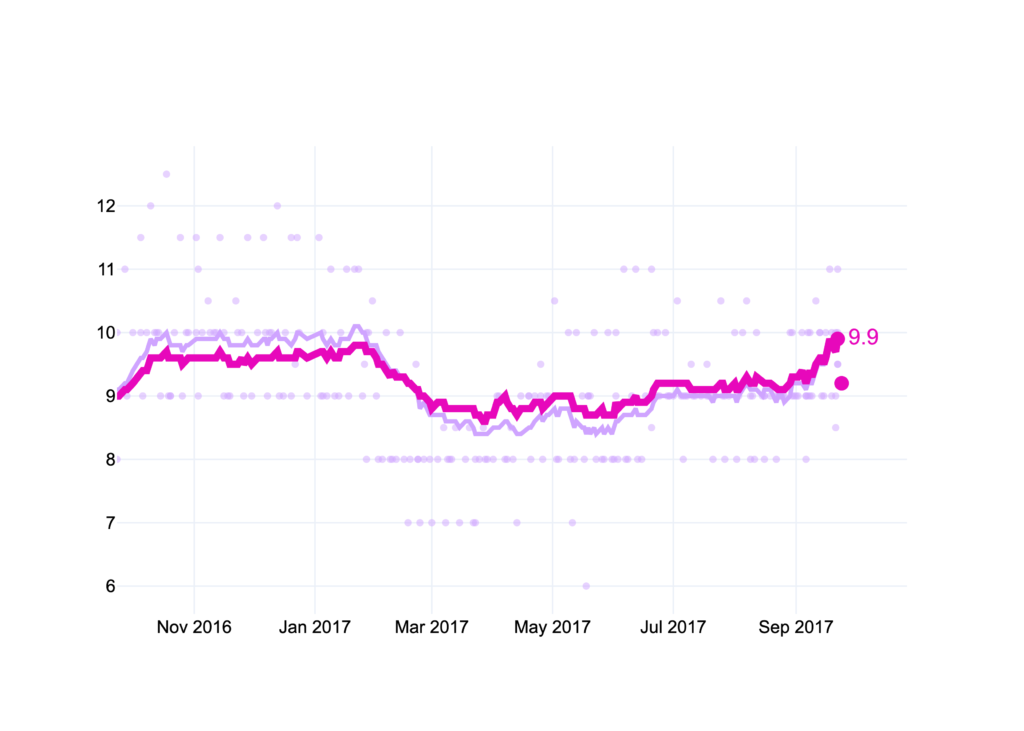
When we add the Vorcast Model output to the chart, we see that the model predictions show even fewer swings. This is what you want out of a good model: a steady trend without big movements (unless the fundamentals of a race really do shift). You want the model to be able to filter out the noise and see the signal.
In praise of German polling firms
I just spent an entire section telling you that polls are unreliable without some form of aggregation… but that doesn’t mean that polls are bad.
In fact, polls are the most precise instrument available to us in order to gauge how the electorate feels. Kind of like that old saying about democracy: it’s the worst form of finding out what the electorate thinks except for all the other ones.
For my polling average, I looked at the accuracy of polls for all federal elections from 1998 to 2017 from 8 polling firms in Germany. If you want a super macro verdict about them, here it is: they’re good.
Looking at the mean absolute error (MAE) across the entirety of the past six election cycles, they tend to be off between 2.6 to 3.5%. This metric isn’t really all that helpful, since it’s the accuracy of their results at any point during the past 6 cycles, for any party (big or small).
MAE | |
YouGov | 2.6 |
Allensbach | 2.9 |
Infratest | 3.0 |
Emnid | 3.0 |
Forsa | 3.0 |
Politbarometer | 3.2 |
INSA | 3.4 |
GMS | 3.5 |
At the time of writing, we’re a little less than six months away from the next German federal election on September 26, 2021. So let’s see how precise the polls were at this point in the past.
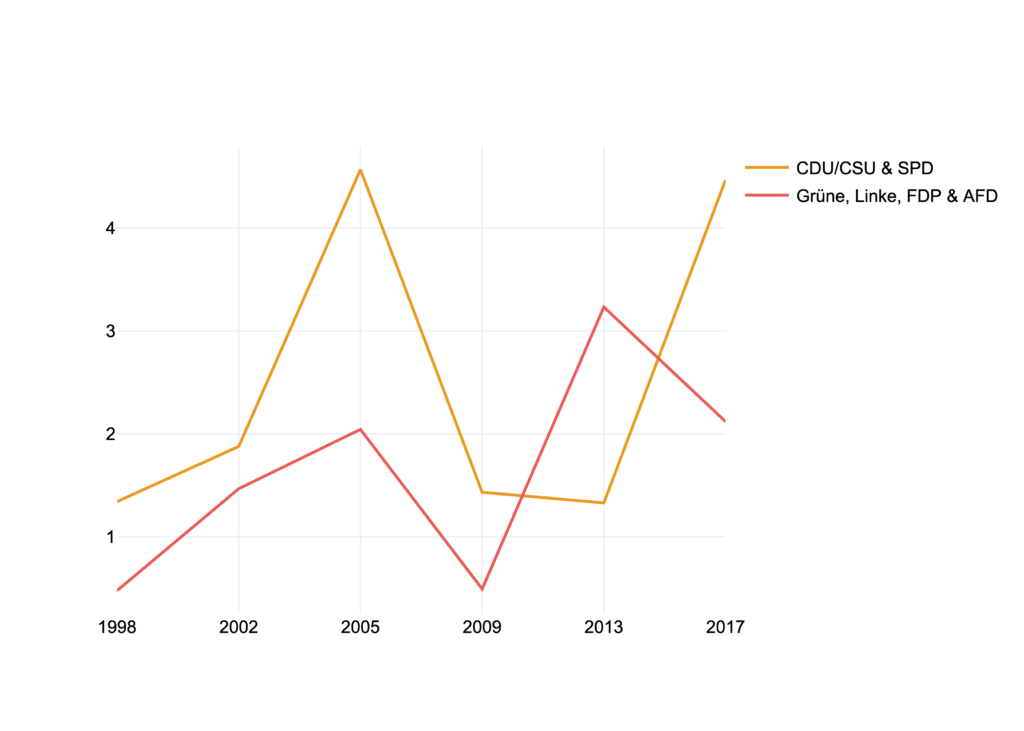
I’m measuring the accuracy of the Vorcast Polling Average in the chart below. There are two lines, one for the larger parties, the CDU/CSU and the SPD (back when the SPD still polled like a big party), and one for the four smaller parties who receive a smaller share of the votes. I’m separating these two groups, because if your vote share will be around 10%, a swing of two points is more important than if your vote share is around 35%.
At this point in the election cycle, at their worst, polls were off by an average of 4.5%, but in other years they were only off by less than 1.5%. So basically, you can look at the polling average now and you already have a pretty good idea of how things will look on election day…most likely. Of course, there can still be shifts in the electorate. But no other form of analysis, reporting, or opinionating will get you closer to the way people actually feel about their voting intentions — and that’s remarkable.
The way vorward (because this is Vorcast, get it?)
Now that I’ve explained the basics and benefits of aggregating polls, here’s how I create my polling average.
Instead of just gathering any number of polls and taking the average, I create a weighted average. Weighing an average basically means that you emphasize certain data points more than others because they are more significant. I assign two different weights to each polling result.
The first weight is an individual weight for each of the eight polling institutes. This weight is based on their past accuracy, methodology, and my own analysis. The point of this weighing is to assign a greater weight to the polls that are more precise.
The second weight correlates with how recent that polling result is. The more recently the poll was taken, the bigger its weight becomes. Depending on where we are in the election cycle, I include polls as far back as three months or more. The reason for this kind of weighing is to include a bias against sudden, short-term shifts. It is an expression of the rule that generally things tend to revert (somewhat) to the mean.
The chart above displays the data for the SPD in the final year of the 2017 election cycle. The SPD was flying high in the polls from February until April. They ended up with a vote share that was about two-thirds of their polling numbers at that point. As you can see, the polling average moved up significantly as well. But unlike the polls, it never went above 30%. The way the Vorcast Polling Average is calculated makes it biased against sudden shifts. Unless, that is, these shifts turn into long-term trends.
My polling average is the most important part of my prediction model because there is no better way to find out what the electorate really looks like at any given point (for the other parts of the model, you can go to this page). So next time you see a poll with a positive outlook for your favorite party, try to look at a few more to get a more accurate picture… or just head back to Vorcast.