(updated February 22, 2025)
Here are the latest predictions for the next German federal election that will be held on February 23rd, 2025:
The thick lines are my model’s predictions for the final vote share. The dots are individual polls and the thin line is a simple 2-week polling average.
For more in-depth posts about the state of the race, check out the latest posts here.
The purpose of this model
If you’re here, you’re either interested in German politics, data journalism, or both. The Vorcast Model (pronounced like “forecast” for all my non-German speakers out there) is a prediction model for Germany’s main political parties powered by subjective analysis, applied statistics, and the mildest form of machine learning.
The primary purpose of any prediction model is to give the user an idea as to what the future will look like before it happens. Any proper prediction model necessarily needs a ton of qualifiers to ensure the user understands exactly how predictive this model actually is. I’ll get into that later.
The Vorcast Model aims to do the following:
- Provide a more accurate picture of the German electorate without the noise you get in individual polls, public discourse, or media hype.
- Encourage and enable critical thinking about what really matters to German voters.
This page will explain the benefits in more detail. I will also explain how the model is made, address the uncertainties of its predictions, and where I gathered the data that is being used.
What’s in it
The model, in its current iteration, is relatively simple. There are many possible additions that can (and will) be made, but for now, it consists of these parts:
- The Vorcast Polling Average
- A regression forecast based on economic data and other factors
- Long-term partisanship (LTP)
- Term fatigue
Let’s go through them in order. The Vorcast Polling Average is a weighted average of all the main polling institutes that regularly poll the German electorate. A mountain of gratitude goes out to the people who run https://www.wahlrecht.de/. I wrote web scrapers to extract the polling data from the 8 polls they display on their website. The weights assigned to each poll are based on historical accuracy, the methodology of the respective polling institute, as well as my own analysis. The weight of this average in the overall model grows the closer we get to the actual election.
The regression forecast is a multivariate regression running on several factors that correlate with the election results of the last six election cycles. This forecast is then weighted based on when it is made during the election cycle.
The last two features are both refinements of ideas that were formulated in the paper “The chancellor model: Forecasting German elections” by Helmuth Norpoth and Thomas Gschwend. LTP is simply the last couple of election results of each party with a shrinking weight the further this result lies in the past. The term fatigue is a factor that uses the negative correlation between a party being in power and their election results. The approach of the paper, which adds another feature based on the candidate’s popularity, works very well for 20th-century Germany when the political landscape looked more like a two-party system (with the FDP sometimes acting as the junior coalition partner).
Contemporary politics in Germany is much more diverse and fluid and a lot of the assumptions the paper is based on (including LTP and term fatigue) do not hold as true anymore. Germany has undergone a remarkable diversification of the political electorate. That is why a lot of the data pre-1998 is not really all that relevant when trying to produce a forecast for modern-day Germany. The political landscape of today calls for a lighter touch when it comes to these heavy fundamentals.
All these features are then combined to produce the model forecast.
Benefits: empirical and applicable
I believe this prediction model’s benefits can be separated into two categories: the empirical and the useful.
Its empirical benefits are easier to define. When we look at the mean absolute error (MAE) as well as the root of the squared mean error, the model is more precise 5 out of 6 times across the entire election cycles of the last 6 elections. To put it simply: it’s both more precise and has fewer outliers than the polling average. That in itself is already pretty good. More importantly — it offers a more accurate view of the electorate from the beginning of the election cycle.
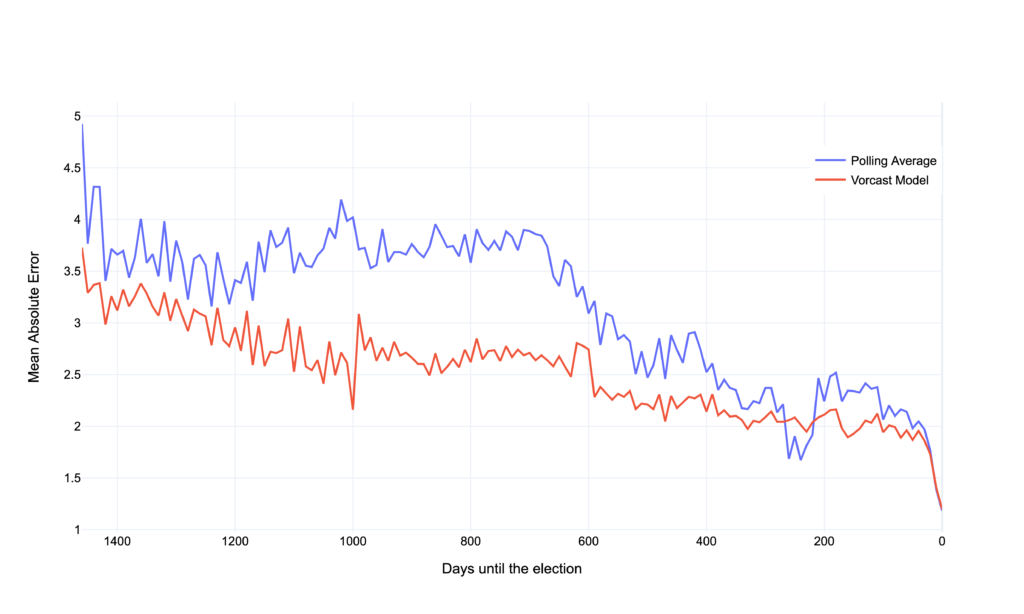
This graph shows the mean absolute error averaged across the last six elections for both the model and the polling average. The model offers a more accurate estimate of what the electorate looks like even at the beginning of an election cycle.
This proves the model’s benefit empirically — but doesn’t necessarily make these benefits tangible to all its users. A different way of explaining the model’s usefulness is by looking at its output.
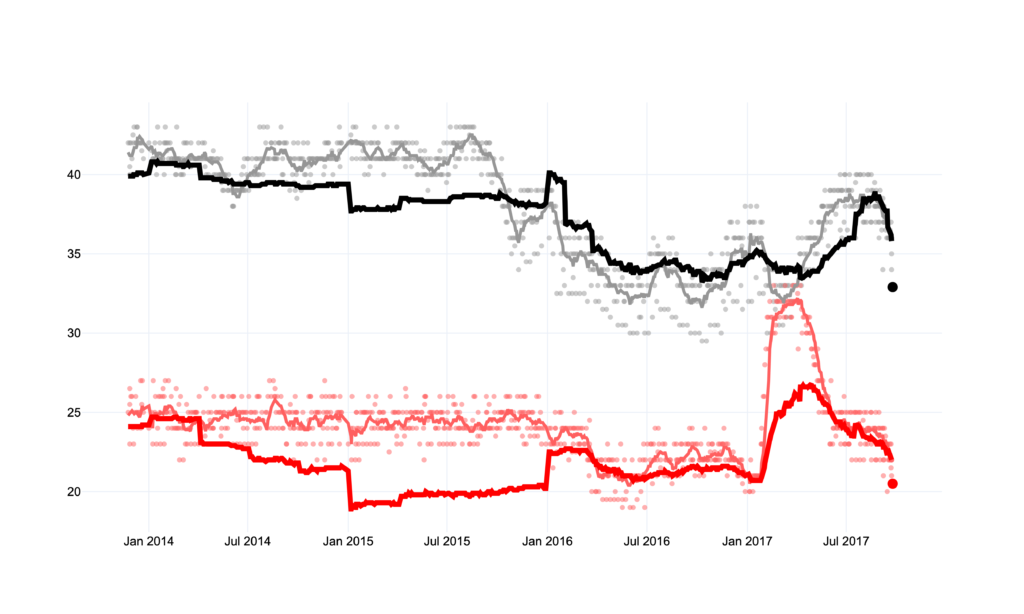
This chart represents the entire election cycle of the 2017 election. Each dot represents an individual polling result for the respective party. The large dot at the far right represents the final election result. The model (as well as the polling average) shows steadier trends compared to individual polls. Looking at the CDU/CSU and the SPD, we can see that their poor performance was captured by the model quite early on. Additionally, when we think of the individual dots as the noise, we see that the model presents a much more steady trend with less fluctuation. Inversely, the larger swings in the model are a sign of real changes in the electorate and can be taken more seriously than polling outliers.
This is what I would call the useful category. The benefits of using the model are instantly clear. We can see a prediction of the election results months in advance and can filter out the noise of individual polls, media hype, and public discourse.
Is it accurate?
Sure, I mean, yes, certainly, to a degree… if you can live with some uncertainty. I outlined in the purpose section why this forecast is useful and more accurate than just looking at polling data. Generally, you can apply the same margin of error to it that the polls have (typically around 3 points in either direction) since the model is based to a large degree on polling data. I decided to exclude ranges of the margin of error from the charts for now since I feel that they do not add vital information.
I would encourage you to use this model in the way you would use any well researched-opinion on something. Vorcast’s accuracy can be statistically proven — but it also lies in the eye of the beholder. How important is it for you to know how strong the Grüne will be in this election? What are the repercussions of a weak CDU/CSU and a strong Linke? Why do you want to know if the SPD will make a comeback?
Predictive models try to show you a world that’s more likely to occur than not. If this model does its job right, you can look at it on any given day and you can see where things truly stand in German politics.
Sources
Polling data
Polling data is collected from https://www.wahlrecht.de/. The 8 polls that are featured in the average are:
Allensbach, Kantar Emnid, Forsa, Politbarometer, GMS, Infratest, INSA and Yougov
Forschungsgruppe Wahlen, Mannheim (2020). Politbarometer 1977-2019 (Partielle Kumulation) . GESIS Datenarchiv, Köln. ZA2391 Datenfile Version 12.0.0, https://doi.org/10.4232/1.13631.
Economic data
OECD (2021), Quarterly GDP (indicator). doi: 10.1787/b86d1fc8-en
Inspiration
To anyone who is remotely interested in this topic, it will be obvious that a huge inspiration was the work of 538, especially their presidential forecast. The Economists presidential model was also a big inspiration.
I also have to mention the conversations I had with my friend Rouwen Hirth, which are what got this project going in the beginning. Thanks, Rouwen!